
If defined-benefit pension plan sponsors are looking for a respite from the extreme fluctuations in funded status seen over the last few months of 2018, they probably shouldn't hold their breath. After the fourth-quarter selloff, money managers seem resigned to the idea that financial markets will remain volatile for some time. The transition back to trend-like growth in the United States after a year of stimulus was never likely to be smooth sailing, but the recent weakness in China, concerns over trade relations, and the ongoing tightening by the Federal Reserve have made for an extremely uncertain outlook.
Fed Chairman Powell has managed to engineer a recovery from markets' December lows by suggesting the Fed will likely hold rates steady for much of the year. The question now becomes how long the rally might last.
Few plan sponsors expect valuations to jump all the way up to where they were at the end of the third quarter, when the average corporate defined-benefit plan's funded status hit nearly 92 percent. Frankly, the overriding sentiment among many strategists and managers of risk is that while there may be a tactical opportunity to base investment decisions on the Fed's “prolonged pause” and the possibility of a U.S.-China trade detente to come, rallies are there to be sold, not bought, as the business cycle advances in age.
That means volatility will likely remain a fact of life for defined-benefit plan sponsors. In the fourth quarter alone, plans' average funded status dropped by 8 percent, which erased the entirety of the gains made in 2018.
 As funded status recovers, it is worth reflecting on how quickly markets can move in adverse ways. Indeed, the Q4/2018 hit to funded status could have been much worse had yields rallied (declined) more. Most of the damage to funded status came from the drop in equity prices. The effects were dampened by corporate yields inching higher because spreads widened slightly more than Treasury yields dropped. This increased liability discount rates for plan sponsors. In a more severe risk-off event, where the Fed was forced to cut the policy rate, longer-dated corporate yields might fall, causing the present value of plan liabilities to increase.
If anything, the volatility of the fourth quarter reiterated that there is a strong case for a disciplined approach to pension plan de-risking. But those decisions should not be driven solely by the interplay between equities and yields. As the credit cycle enters its later stages, issuer selection and avoiding downgrades are set to become much more important. Corporate plan sponsors who decide to adopt a liability-driven investment (LDI) strategy will need to exhibit discipline in how they implement and conduct that plan.
Explosion of Downgrades in Q4
The nature of the shareholder-friendly behavior going on during this credit cycle—i.e., debt-funded share buybacks, dividend increases, and mergers and acquisitions (M&A)—is that it tends to be driven by the objective of maintaining investment-grade ratings. However, downgrades are still a concern. In the fourth quarter of 2018 alone, more than 10 percent of the universe of long bonds with a rating of A or better were downgraded to BBB in the United States—with General Electric, Anheuser-Busch, Altria, Lowe's, AstraZeneca, and PG&E among them. In fact, well over half of the investment grade index-eligible universe are now rated BBB.
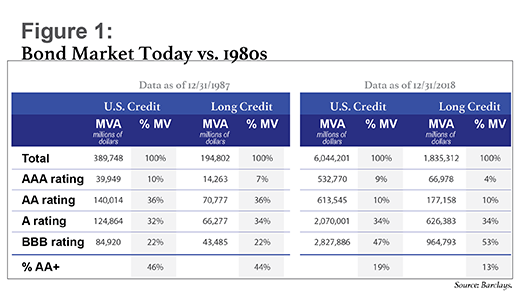
The impact of this trend on companies that remain A or better should not be overlooked, particularly from the perspective of a liability hedger. First off is the concentration risk that stems from lack of diversity in corporate bond indices. Back when FAS 87 came into effect in the mid-1980s, AA or higher bonds comprised nearly 50 percent of the investment-grade bond market. Today, AA or higher corporate bonds comprise less than 20 percent. In fact, there aren't even enough AA corporate bonds outstanding (around $1.1 trillion, according to Barclays) to cover the value of pension liabilities outstanding today (around $3.1 trillion). Figure 1 shows a summary of the corporate bond market, split by full maturities and long-duration (10+ year) maturities.
The multi-decade downward migration of higher-rated credits means that companies which are able to avoid being downgraded while engaging in mergers and acquisitions (M&A) or debt-funded buybacks are becoming an ever-larger presence in the higher-quality corporate indices. Among long-duration AA-or-higher bond issuers, for instance, the top 10 issuers make up more than 50 percent of the market, and the top five encompass just over 40 percent of the market.
In other words, there is a tremendous amount of issuer concentration. Take the example of Microsoft: The technology company did not issue any debt in 2018, yet it makes up 13 percent of the long-duration AA-or-higher index. Adding A-rated credits into the investment mandate does not completely eliminate the problem. For instance, since Comcast purchased Sky in the U.K. last year, its debt now accounts for 5.25 percent of all U.S. long corporate A-or-better debt.
The string of downgrades that major U.S. corporates experienced in the fourth quarter of 2018 illustrates how more-concentrated indices can lead to disruptive outcomes when rating agencies decide to act on larger issuers. General Electrics' loss of its A rating caused its benchmark long bonds to widen 125 basis points (bps) from the beginning of October to year-end, while A-rated long bonds in general widened just 30 bps over the same time period. Likewise, bonds from Anheuser-Busch and Lowe's widened by 80 bps to 85 bps.
This is the second problem with the Q4/2018 downgrades: The scarcity of debt rated A or better leads to overvalued prices that are susceptible to large corrections upon a downgrade. It's Economics 101. If demand remains constant while the supply of higher-rated credit decreases, then prices will adjust higher. Reality is not that simple, of course—demand is never constant from year to year—yet the basic narrative is correct. The universe of higher-quality investment-grade bonds is not growing nearly as quickly as BBB-rated bonds. At the same time, buyers based in Asia, who have become a very important source of demand, continue to prefer higher-quality debt. The result is that bonds rated A or higher tend to trade at ever tighter spreads.
For liability-driven investors, the pricing effects of downgrades of formerly A-rated debt are a real concern. Historically, when an A-rated company was downgraded to BBB, the spread of the company's bonds vs. U.S. Treasuries tended to widen an average of 25 bps to 30 bps. Yet the current environment is resulting in larger transition costs; downgrades are resulting in spread widening of 50 bps to 100 bps. Active management that results in underweighting these companies beforehand can reduce the impact, but at the end of the day, downgrades lead to negative pricing performance.
More insidious for pension plans, downgrades can have a substantial effect on discount curves. When dealing with defined-benefit plans in the United States, there two principal discount rate methodologies that plan sponsors focus on in their annual calculations of liabilities. One they use to discount liabilities for accounting purposes, and the other they use in determining their required contributions to the plan under the Employee Retirement Income Security Act (ERISA). Discounting for accounting purposes requires liabilities to be discounted using “high-quality corporate bond yields,” which has historically been taken to mean bonds rated AA or higher. Discounting to determine contribution requirements is explicitly based on bonds rated A or higher.
Thus, when a large issuer with an A or AA rating is downgraded, that change can increase liability valuations, which in turn lowers funded status. Downgraded bonds almost always leave the A or AA index at a wider spread than the bonds that remain in the index, so their removal reduces the spread and average yield of the index. For plan sponsors, this increases the value of the plan's liabilities while the value of assets that are hedging those liabilities doesn't change.
When larger issuers are downgraded, this type of “uninvestability drag” can really add up. Generally, uninvestability introduces a drag on pension funding ratios of about 1 percent annually. This is a key factor supporting the use of active management when investing in corporate bonds.
The Need for Customized Strategies
The volatility in funded status that can result from downgrades is meaningful, but failing to properly hedge the plan's liabilities can create even more volatility. As such, it makes sense for plan sponsors to continue seeking ways to lock in gains in funded status while looking for ways to minimize downgrade risk in their fixed-income portfolios.
One counterintuitive—but increasingly accepted—approach is to add BBB-rated companies into the defined-benefit plan's fixed-income allocation. Because BBB issuers make up such a large proportion of the universe of investment-grade credits, investing in BBB-rated debt has large enough benefits to issuer and industry diversity, trading liquidity, and the ability to create alpha that they appear to outweigh the increased risk of holding lower-rated debt. This is particularly true when the plan's investment mandate is paired with a portfolio of government securities, to improve the weighted-average rating.
Arguably, adding BBB-rated securities to fixed-income portfolios is just an exercise in replacing one risk with another. Clearly, BBB-rated debt is at higher risk of a downgrade to high-yield, which tends to be even more punitive than the shift from A to BBB. However, many BBB-rated companies are actively looking to deleverage after issuing debt to fund acquisitions. If they fail to reduce debt in the coming years, these companies may be at risk of a downgrade, a situation that closely aligns the incentives of the management team and the bondholders. In other words, disruptive BBB downgrades could become an even larger problem than A-rated downgrades, but the risk and reward are well-balanced. Active managers who invest in BBB-rated bonds can create value by selecting winners and avoiding losers.
Another approach to mitigating downgrade risk in a plan's investment portfolio is to limit the volume of debt the plan holds from any single issuer. Whether the plan buys only A-or-higher debt, or it has a full-spectrum portfolio, capping exposure to any individual company at 1 percent or 2 percent can help avoid overly concentrated exposure that would be harmful to performance if that company were downgraded.
LDI and the Case of Mismatched Liabilities
Consider the following case study of changes to a hypothetical plan's funded status in Q4/2018. This simple example demonstrates how ineffective a plan's hedging may prove to be during a volatile period, even if the hedging looks effective on paper.
A company has a $1 billion pension plan that is 100 percent funded as of September 30, 2018. Half of its assets are allocated to return-seeking assets, which it benchmarks against the MSCI All Country World Index. An LDI approach has convinced plan decision-makers to invest the other half of its assets in liability-hedging securities, which the plan sponsor benchmarks against the Bloomberg Barclays Long-Duration U.S. Credit. (See Figure 2.)
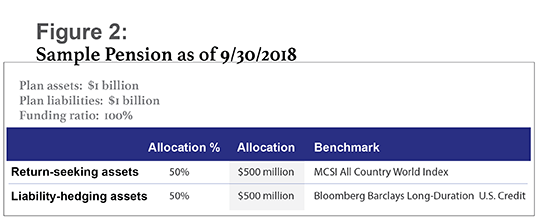
This is could be considered a “typical” pension plan. Its liability discount rate is based on AA bond yields, with a liability duration of 12.5 years. Meanwhile, the assets that the plan purchases to offset those liabilities, as represented by the Long-Duration U.S. Credit index, span a range of investment-grade credit qualities and have a duration of roughly 13.4 years. The duration differential indicates that the sensitivity between price and yield is noticeably higher for the assets than for the liabilities. Nevertheless, the plan's hedge ratio is 54 percent—($500 million LDI assets x 13.4-year duration) / ($1 billion plan liabilities x 12.5 year duration)—which means that the plan sponsor expects, all else being equal, the assets to return $54 for every $100 in liabilities.
Unfortunately, over the course of Q4/2018, market volatility picks up mightily. The MCSI All Country World Index loses 12.68 percent in the quarter, while the Bloomberg Barclays Long-Duration U.S. Credit loses 1.64 percent. The plan's liabilities decline slightly; discount rates remain flat through the quarter, so the only significant change to liabilities is a slight reduction as retirees receive benefit payments. At the same time, however, both of the plan's asset portfolios—both the return-seeking assets and liability-hedging assets—decline faster than the liabilities do. (See Figure 3.)
 Although the plan appeared to be well-hedged ex ante, the difference in duration between its assets and its liabilities means its funding ratio falls by 8 percentage points in Q4/2018 due to market movement, even as liabilities remain, essentially, constant. While this outcome would not be surprising if 50 percent of the plan's assets were equities, the decline in liability-hedging assets—compared with what was expected—illustrates what can occur when plans use assets of one credit quality to hedge a liability that is a fundamentally different credit quality.
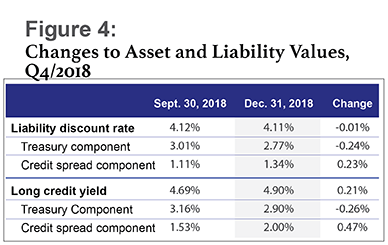
We can illustrate this point by looking at the effect of Q4/2018 on yields for the plan's liabilities and the assets intended to hedge those liabilities. Corporate bond yields (and, in turn, liability discount rates) can be broken down into an interest rate component—i.e., Treasury yields—and a credit spread component. Over Q4/2018, liability discount rates barely changed, as increasing credit spreads on the AA bonds used to calculate the discount rate were offset by declining Treasury yields. However, because spreads for bonds in the Long-Duration U.S. Credit index widened considerably more than Treasury yields declined, yields on the plan's liability-hedging assets increased by 21 bps. In fact, the rate at which credit spreads for the LDI bonds widened was more than double the rate at which the liability discount rate's AA credit spread component grew. Because yields on broader-investment-grade debt are so much more volatile than are the AA bonds used to calculate the plan's liabilities, this hedge turns out to be quite ineffective during a period of market stress and downgrades, such as Q4/2018, no matter how good the hedge looks on paper. (See Figure 4.)
At a broader level, the fact that the credit spread component is changing faster for the assets illustrates the volatility differential between how the full market of investment-grade corporate debt behaves versus higher-quality bonds. Although many plans utilize all levels of investment-grade debt in their liability hedging, this volatility differential suggests it might be a good idea to take a closer look at how the LDI strategy is constructed.
A More Nuanced Approach
An alternative to just utilizing long-duration credit is utilizing a duration-matched LDI strategy that blends corporate debt with Treasury/agency allocations. Such a strategy might enable plan sponsors to better align the credit quality of the LDI strategy to that of the liability.
For example, Figure 5 shows a custom-designed allocation for a plan that blends four Barclays indices both for duration and appropriate sizing of the allocation to credit, to match the volatility of the liability discount rate.
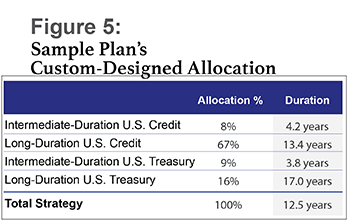
This blend aligns to a 75 percent allocation to investment-grade corporate debt and a 25 percent allocation to Treasuries. Now, let's see how this portfolio performs in Q4/2018 relative to the Long-Duration U.S. Credit index alone. To produce an apples-to-apples comparison, one needs to either normalize for the ex ante hedge ratio or else allocate the same amount of money to each strategy and accept the hedge ratio differential. In this case, either approach delivers the same conclusion, so in the interest of simplicity, we'll assume that each strategy is allocated $500 million.
We already know that the Long-Duration U.S. Credit alone produces a 54 percent hedge ratio. Because the point of the custom-portfolio strategy is to match asset duration to liability duration, we expect the custom portfolio to produce a 50 percent hedge ratio. Figure 6 illustrates the outcome of each strategy over the quarter.
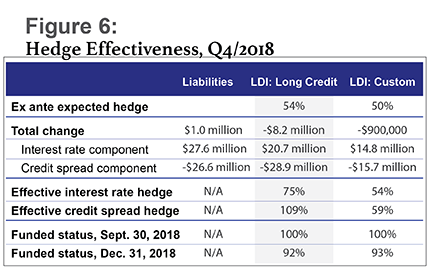
In this case, a 50 percent allocation to Long-Duration U.S. Credit, which covers the full investment-grade market, produces a hedge that is more than 100 percent effective, while customizing the strategy to the liabilities provides an outcome much closer to the 54 percent hedge ratio expectation. While a simplistic example, it shows that the construction of the LDI strategy can improve the tracking to the liability and mitigate the impact to the funding ratio during a volatile period.
LDI is not a one-size-fits-all strategy, but rather a nuanced implementation that should be designed to meet the specific objectives of the individual plan sponsor. Over 2019, if the market forecasts hold, plan sponsors will likely learn not only about the amount of hedging their liabilities require, but also about the desirable composition of the plan's asset portfolio. We recommend a thorough review prior to any further market turmoil.
 Jodan Ledford is head of client solutions and multi-asset for Legal & General Investment Management America (LGIMA). He joined the company in 2013 as head of U.S. solutions. In 2017, Ledford's role expanded to include oversight over each of the distribution, client relationships, solutions strategy, product, and multi-asset portfolio management areas. Prior to joining LGIMA, he was executive director and business head of asset liability investment solutions at UBS Global Asset Management.
 Jason Shoup is head of global credit strategy for Legal & General Investment Management America. He joined in 2015 as senior portfolio manager and fixed income strategist. In 2018, he was appointed head of global credit strategy. In this role, he is responsible for leading the global strategy process and working closely with the Chicago and London offices for both active fixed income and global high yield. Prior to joining LGIMA's Fixed Income Portfolio Management team, Jason spent 10 years at Citigroup, where his most recent position was director, head of U.S. high-grade credit strategy, where he advised institutional clients and published credit research reports.
© Touchpoint Markets, All Rights Reserved. Request academic re-use from www.copyright.com. All other uses, submit a request to [email protected]. For more inforrmation visit Asset & Logo Licensing.


