

 Last September, in an article titled "CFOs Taking the Heat," we examined how CFOs and corporate treasurers can understand whether their finance function needs to undertake a major infrastructure transformation. Deciding to move forward is just the first step in getting such a project under way. Once a finance team is contemplating a transformation initiative, it faces the daunting task of justifying the expenditure. Various metrics are available, including net present value (NPV), payback, and internal rate of return (IRR), but one of the best tools is an analysis of the project's return on investment (ROI).
In the context of transformation projects, ROI is a cash flow metric that allows senior executives to make an informed decision about whether to proceed. It also provides a numerical look at various scenarios to help executives decide on the optimum approach. Creating a solid ROI analysis for a project is extremely hard to do well, but it's well worth the effort, for both technology-focused and non-technology initiatives.
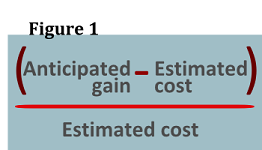 An ROI projection can inform decisions around the priority of each project deliverable and the sequence of the deliverables, and it can help deconstruct a specific deliverable into phases. The ROI figure usually presents the anticipated cash flow for the duration of the project, sometimes extending even further into the future. Figure 1 shows a simple version of a project ROI calculation—the net cash flow gain that the project should deliver, divided by the anticipated cost of the project. What this equation does not address is year-over-year (YoY) ROI, which can change drastically over the life of a transformation project. We typically see a low or negative ROI in the first six to 12 months; then the ROI escalates over the next one to three years, at which time it plateaus. Projecting the YoY ROI up front is important because capex decisions early on can influence returns throughout the course of the project.
Recommended For You
Inputs into the Equation
A project ROI calculation involves two primary inputs: first, anticipated cash flows for the benefits the project is expected to achieve, and second, anticipated costs.
In terms of benefits, most treasury projects involve cost savings, but they rarely involve revenue increases. Some savings are readily tangible, such as reduced payroll costs; others are intangible, such as reducing the risk of fines. The benefits of a project are generally the project's goals, and it's important to be realistic about those goals. For example, if you're automating a currently manual job, is it realistic to expect that you'll be able to eliminate the position?
Most benefits of corporate treasury projects come from staff reductions—as a result of automation or centralization of an activity—and fee reductions due to the consolidation of bank accounts or banking relationships, payment netting, etc. Treasury teams can also achieve benefits around improved liquidity management by shrinking cash-on-hand reserve requirements, which reduces the need to draw on credit facilities for capital investments, which in turn reduces interest charges.
 On the cost side, a treasury transformation project is likely to involve a one-time expense to acquire the core software package, plus recurring vendor charges, implementation fees, the technology infrastructure purchases necessary to make the project successful (including business continuity planning), temporary workers to pick up the day-to-day workload for staff whose attention is dedicated to the project, system integration costs, project management overhead, and staff retraining expenses.
It's important not to underestimate the potential system integration costs. These are often a hidden line item, since they generally involve internal staff members who would otherwise be working to keep the lights on or would be involved in other, smaller projects. A shiny new treasury management system may come with a full-featured wire payments module, but it will still need to be hooked up to the company's accounts payable (A/P) and general ledger (G/L) systems. And those hookups are usually subject to Sarbanes-Oxley oversight, making the process that much more costly.
Infrastructure costs, such as capex for hardware and software, should usually be included in an ROI calculation on an allocation basis across the life span of the project. The allocation algorithm should be specific to the individual initiative, but some heuristics can apply universally. For example, if you are implementing an automated wire-payments system, you may examine the relative transaction volume in each rollout stage and allocate the costs accordingly. Recurring costs, such as vendor licensing fees, are typically easy to apply based on the estimated number of users at each project phase.
Figure 2, below, shows a summary of the inputs into the ROI calculation. Many think of an ROI analysis as a process to hand off to a Big Four consultancy. The finance team will have external advisers estimate ROI at the project's outset and then kick off the initiative after receiving the ROI projection. Nothing can be further from best practice.
Anticipating true costs is exceedingly difficult, especially for large-scale transformation projects, and ROI estimates are frequently off by an order of magnitude when a project is first getting under way. The company or its advisers may underestimate costs and overestimate benefits, thereby distorting the entire ROI formula. Also, examining ROI at the wrong level of granularity can skew the results substantially (see the case study on page 3 of this article). Estimating ROI is a continuous process throughout a project's life cycle. Developing a solid means of generating this estimate, and then updating it as needed, is crucial.
Incorporating ROI Risks
As project managers generate their ROI projection, they must not overlook the attendant risks. For example, a bank consolidation project may look like it will save money through lower fees and better returns on CDs and TDs, but that may be because the bank is troubled and is offering good deals to get deposits in the door. The operational risk aspect of the ROI analysis should not be underestimated.
When assembling the numbers for each ROI input, it is helpful to apply a subjective confidence factor (CF) to each metric at each stage of the project. A 100 percent CF would indicate complete confidence in the accuracy of the metric projection, and the ROI estimate would need no adjustment. However, a confidence factor lower than 100 percent would result in an ROI spread (worst case to best case) rather than a specific ROI number. If, for example, the project team estimates an ROI of $1 million for a particular metric but with a CF of 75 percent, the ROI spread would be $750,000–$1 million.
On the technology side of a treasury transformation project, project risk tends to be fairly low because functionality needs are extremely similar across most corporate treasuries. Vendor products are fairly well commoditized, and there are many subject matter experts available to provide risk mitigation. In addition, most vendor solutions (such as payment netting, target balancing, etc.) have straightforward, quantifiable costs to implement. This is why some consulting firms are able to offer benchmarking services, which compare your current practice to industry best practices.
 What's not readily quantifiable, though, is the human resources side of the equation, especially in countries with labor laws that strongly favor employees. ROI calculations often fail to include the costs associated with staff reductions. Regional labor laws, such as those in France and Spain, can have a dramatic impact on the cost required to eliminate or reduce staff hours. This factor may actually turn the ROI negative for automation projects in some regions. It's important to know about these issues up front.
Another challenging feature of the ROI analysis is projecting the value of intangible benefits, especially avoidance of future costs such as regulation and compliance. You may ask: Why bother with an ROI analysis for a regulatory requirement? Compliance-related projects may not be optional, but they can nevertheless benefit from a rich ROI analysis. For one thing, the timing of fulfilling a regulatory requirement may inform the timing and degree of up-front capex spending. For another, the size of the anticipated fines for noncompliance on each regulatory rule should inform the entire project's rollout schedule. Additionally, a company should consider the cost of manual compliance with regulations; such an analysis may obviate the need for automation or may point to outsourcing as a better option. Finally, a regulator may step back a bit when presented with a well-documented cost analysis and allow the company more time or possibly even ease the compliance rule.
The key to all this is to instill an ROI mind-set, which involves efforts to quantify, if only approximately, both the benefits and realistic costs. This can happen only if you have real benefits that are clear and honest assessments of costs based on real experience. It takes a lot of digging to get this right.
Case Study: Calculating ROI
Consider the case study of a multinational company operating in 20 countries that undertook a project designed to automate wire payments across four regions. The project rolled out in one region per year, with implementation starting in North America the first year and then moving to Latin America in year two, Asia Pacific in year three, and Europe in year four. Its anticipated ROI hinged on the following factors:
Benefits:
• Tangible—Reduction in payroll, elimination of duplicate payments, reduction in fraud, and reduction in transaction fees (through netting).
• Intangible—Avoidance of regulatory fines.
Costs:
Infrastructure capex, procurement of automation software, product implementation, licensing fees, system integration, staff payouts, and training.
 Figure 3 shows a high-level summary of the project's ROI. Examined at the summary level, the project's negative ROI hardly seemed to justify moving forward. However, Figure 4, below, shows an analysis at the regional level, which paints a very different picture. When evaluated by region, the United States, Canada, and Latin America all came in with very positive ROI results. Note that we've assumed, for simplicity's sake, that each regional rollout achieves its full ROI during the year in which its implementation is completed.
As this multinational corporation was working to estimate the project's ROI by region, someone did their homework on APAC and came to some interesting conclusions: The infrastructure costs, as reflected in the project-cost cash flow for year 3, were expected to skyrocket because regional regulations required local hardware installation. Moreover, the benefit was projected to be considerably lower than in North America or Latin America because labor costs for the legacy manual process were relatively low in APAC.

Making the Case
A YoY ROI analysis summary table like the one in Figure 4 should anchor the business case document that the treasury project team presents to the corporate steering committee or project sponsor.
Keep in mind that many business cases include multiple major deliverables. The business case document needs to provide a separate ROI for each major deliverable. Conflating deliverables increases the complexity of the analysis, making it very difficult to do reasonable ROI evaluations. It also makes it difficult to evaluate multiple distinct ROI scenarios for a given deliverable. Of course, there are exceptions to this rule, such as when there are hard dependencies.
Also, make sure to include the confidence factor for each deliverable in the business case. It's important to be realistic about the CFs. A cost pulled right out of the general ledger can get a CF of 100 percent, whereas an intangible benefit like a hoped-for reduction in bank overdraft fees may get a 60 percent CF. When developing an ROI matrix, keep the confidence factors in a separate detail worksheet for each component you are measuring. CF worksheets like those in Figure 5, below, can be referenced throughout your detailed ROI workbook via a soft-link as needed. You can then easily tweak the total ROI calculation as your confidence factors change over the course of the project.

In Figure 6 (below), the lower and upper bounds, or spreads, resulting from the confidence factor are shaded. The CF factors are soft-linked from the list of CFs in Figure 5, because they will appear in multiple places throughout the company's ROI analysis. Note that the factors add to the cost estimate, whereas CFs would be used to reduce benefit estimates. The total CF at the bottom of each region is weighted based on the total lower-bound cost. (A project with a total weighted CF below 75 percent should be reviewed carefully.) Also, note that we round all total amounts up to the nearest $500 because unrounded numbers imply high precision, and this is decidedly not a precision exercise.
We haven't illustrated the effect of the CF on benefits, but it works the same way as costs, except that you subtract from the benefit amount rather than adding, to be conservative.
If the final ROI analysis, which includes confidence factors, results in a negative ROI projection, either too many of the intangible benefits are hard to quantify or else confidence in project cost estimations is low. The company's steering committee will be skeptical of any project with lots of intangibles and broad ROI ranges resulting from low confidence factors. If this describes your business case, then ask yourself this: Don't we have enough real pain points that can be quantified? In most cases, low CFs just mean that the project team hasn't done enough homework. Finance needs to consider every option for improving the confidence factors, possibly including performing a proof of concept or conducting further due diligence.

Evaluating the ROI Result
An ROI analysis is an excellent tool to determine whether a project, or a portion of a project, is justified to commence. But it can carry hidden landmines.
Consider again the wire payments project in our case study. Figure 4 shows a $1.2 million cost at onset. That is a hit the company takes up front, and the ROI analysis charges it against the North American phase of the project. If the project team instead prorated that cost across the entire four years to make the ROI "more fair," they would make the case for North America even stronger—and would make it more difficult to move forward with the APAC portion of the project.
 Suppose that the project commenced under the assumption that all four phases would happen and the $1.2 million up-front cost would be prorated across the four regions. Then, two years into the project, executives decided not to implement the solution in Asia. This change would invalidate, after the fact, the basis for decisions throughout the first two years of the project. The cost spread across four phases should have been spread across only three.
Instead of prorating up-front costs across multiple phases of a project, consider avoiding the big capex hit altogether. Techniques such as leasing equipment and software can distribute costs more evenly over a large-scale project. Most vendors are willing to work with customers on these types of options, though they might charge for financing.
Intangible or poorly quantified benefits can derail an ROI analysis. But in a sense, utilizing confidence factors conservatively can help highlight project shortfalls, so the project champion can use them to his or her advantage. For example, let's say a major objective of your project is to avoid large potential compliance penalties. Precedence for fine amounts is lacking, so you have little to go by in your benefits estimate, which means you set up a low CF. The low CF, in turn, forces you to perform more or better due diligence. The CF risk may inform a different sequencing approach for the project as well.
Another potential landmine crops up when the ROI analysis is disconnected from real-world business strategy. For example, suppose that the treasury project team in our case study decided to cancel the Asia phase of the automated wire payments rollout because of its ROI estimates—without realizing that the company was working to close an acquisition in Asia. If the acquisition would affect the company's transaction volume in Asia, then it would affect the ROI of the APAC phase of the project, and the decision to cancel the APAC rollout might be a mistake. Future cost and benefit projections need to take into account any future strategic plans for the company that could affect a project's ROI.
Beware that the first few ROI analyses for a given initiative will probably not tie closely to the actual results of the project. The project team will get much better at estimating costs as they get to know the vendors involved and understand how internal staff are performing. Hopefully they will also get better at navigating internal ledger systems and will get buy-in when defining company standards for capex allocations.
This is a very hard job, but it is well worth doing. Treasury and finance teams that make ROI analysis a standard component of their business case process are setting themselves up to achieve more successful transformation projects.
—————————————–
 Berl Kaufman is a senior manager with SunGard's capital markets business. A veteran consultant, Berl provides a deep perspective on both business and technical concerns facing executive management today. He has spoken at conferences on client reporting, collateral management, and reconciliation, and has published papers on diverse topics ranging from data management to hedge fund operations and how total quality management (TQM) can be applied to financial services.
© 2025 ALM Global, LLC, All Rights Reserved. Request academic re-use from www.copyright.com. All other uses, submit a request to [email protected]. For more information visit Asset & Logo Licensing.


